Book Review: ‘Source Code,’ by Bill Gates
A new memoir by the tech mogul recounts a boyhood steeped in old-fashioned, analog pastimes as well as precocious feats of coding.

Key takeaways
When comparing Looker vs. Tableau, two of the most popular business intelligence (BI) software tools on the market today, it’s crucial to have the facts laid out as clearly as possible before making a decision.
Business intelligence software executes data preparation and management, data querying, predictive analytics, and many other analytical tools that help managers make better decisions based on BI outputs. We will look at the features of each BI software tool to give readers more insight into which product will best fit their companies.

Overall Score
4.16/5
Pricing
3.13/5
General Features & Interface
3.75/5
Core Features
5/5
Advanced Features
4/5
Integration & Compatibility
5/5
UX
3.75/5
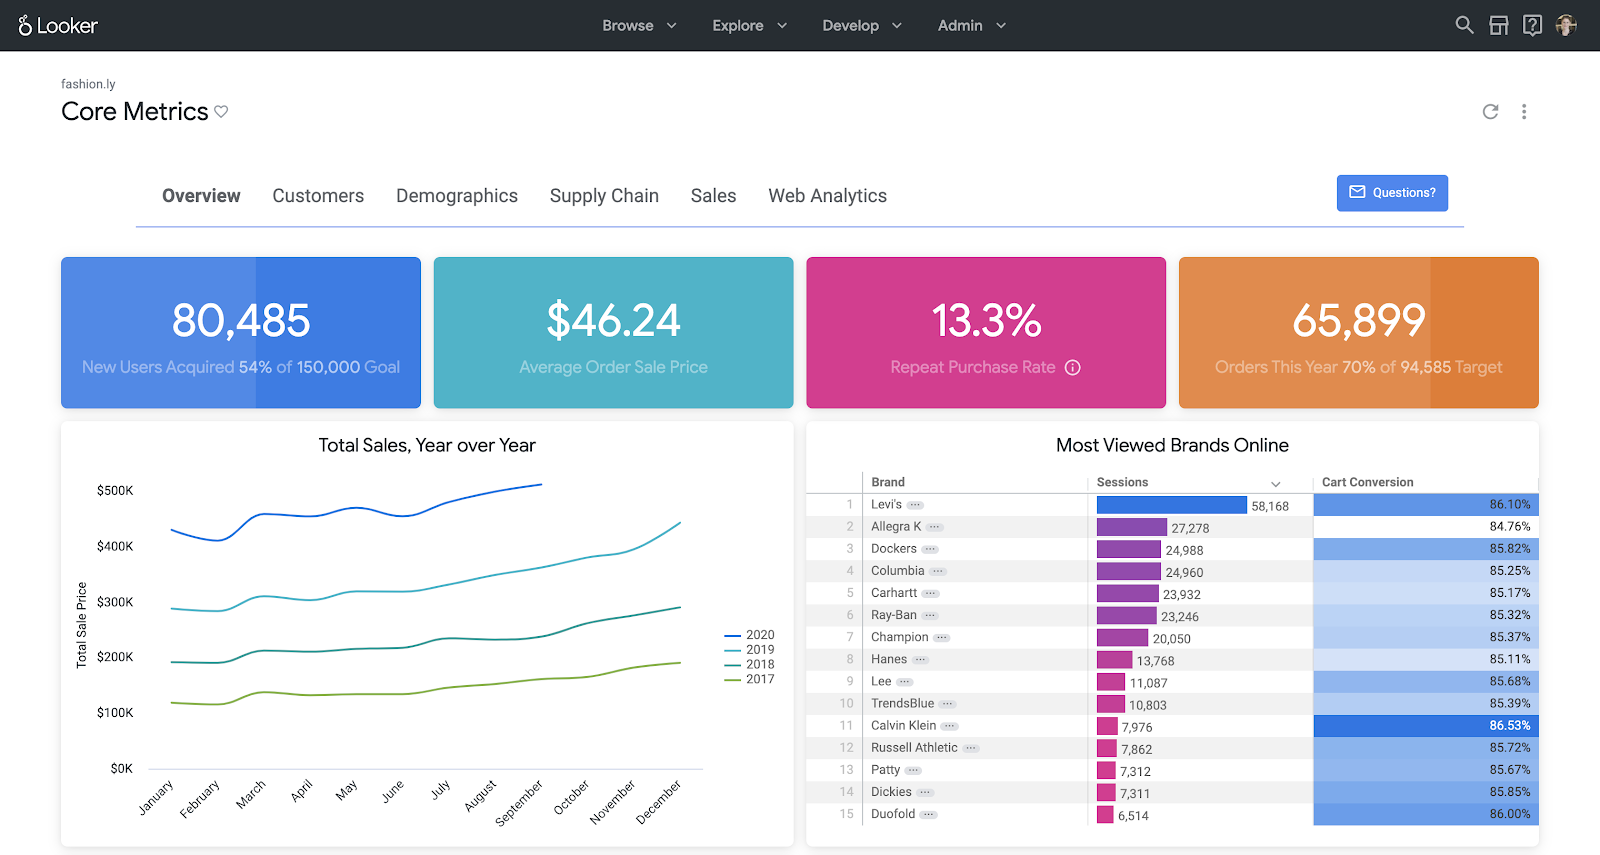
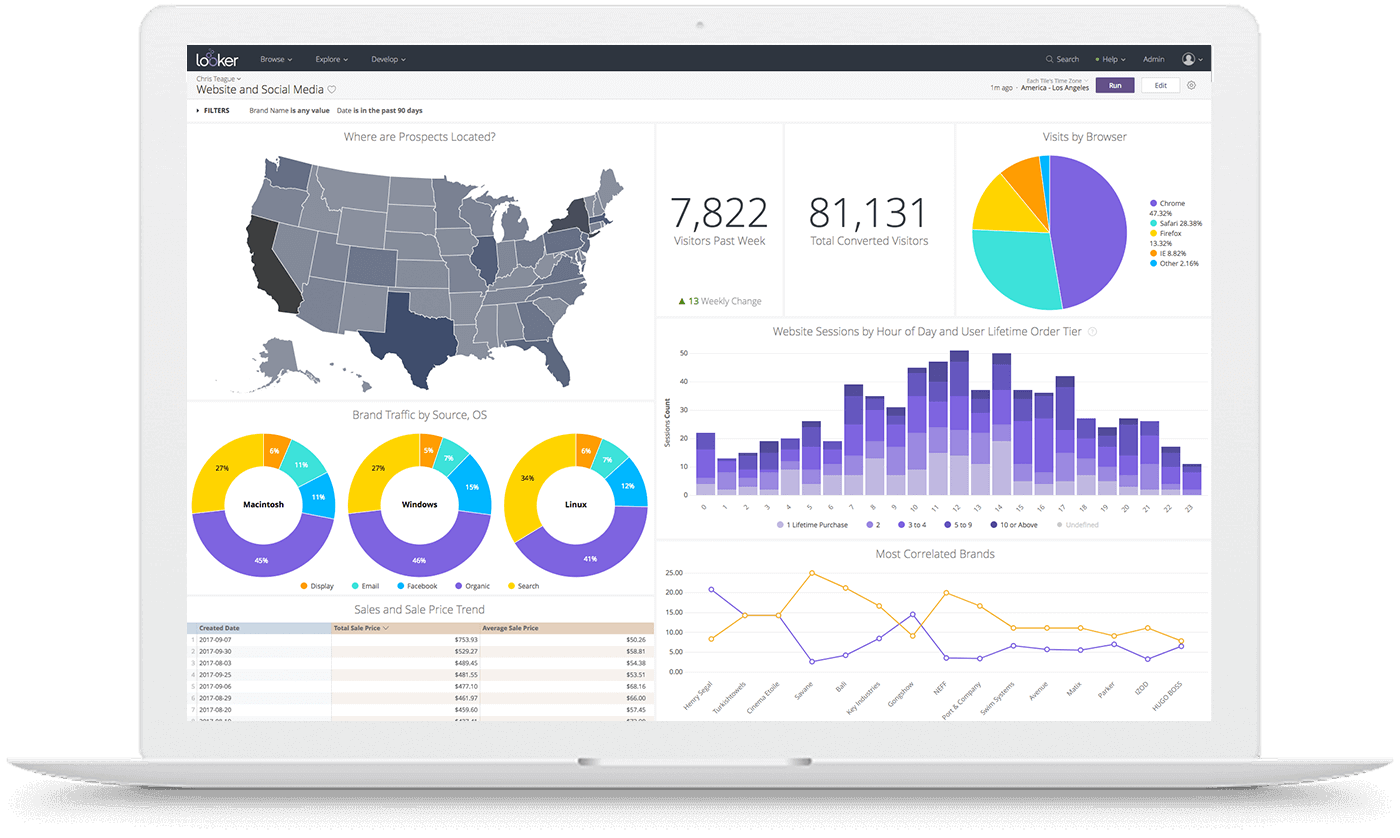
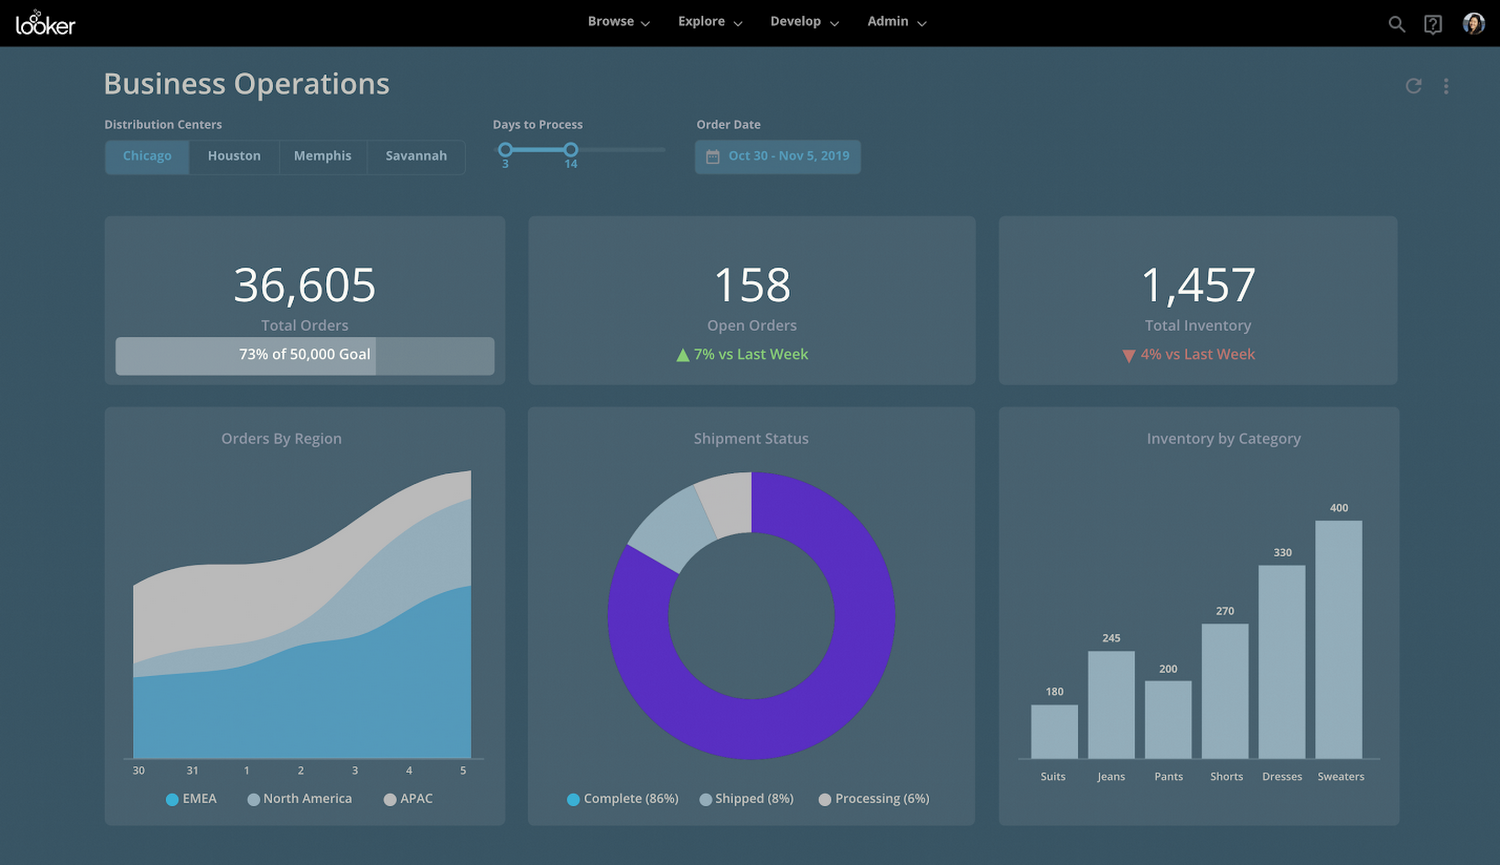
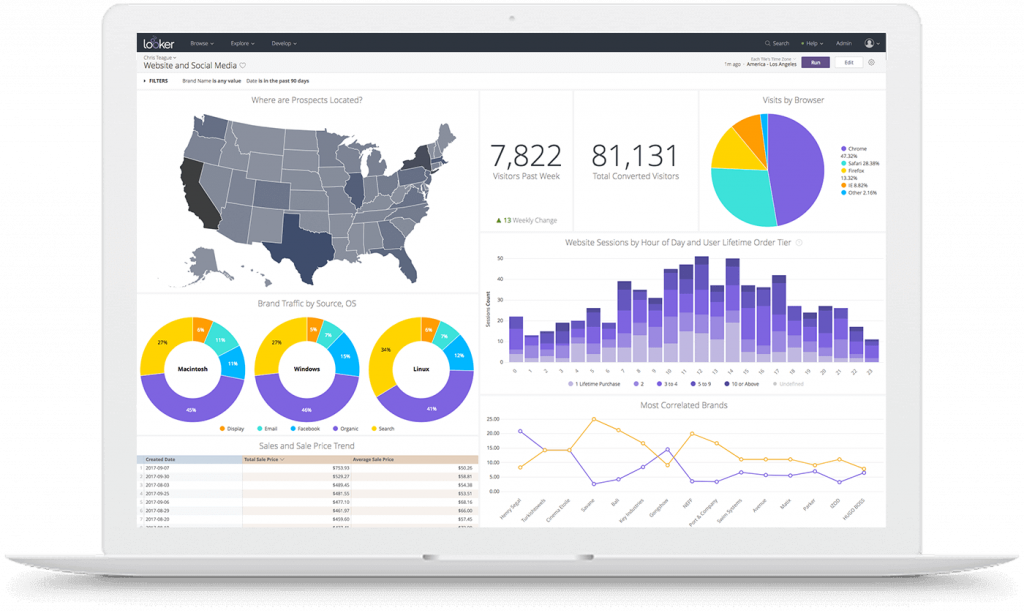
Looker is a cloud-based Business Intelligence (BI) platform purchased by Google in 2019. Designed to offer insights and analytics, its strength lies in the powerful data modeling layer. This layer emphasizes a “single source of truth” model, ensuring accurate metric readings by consolidating information from various sources onto one dashboard.
Looker’s data modeling allows users to define intricate information and create reusable models. These can be used throughout the platform, ensuring data consistency and accuracy. This approach streamlines data exploration, giving users confidence in the displayed data.
The 23.4 release introduced the Looker Studio Connector and Connected Sheets for all Looker-hosted instances. This enhancement allows users to access and analyze Looker-modeled data, expanding the platform’s capabilities. Another feature, the Performant Field Picker Labs, offers refined search options for large Explore field pickers.
• Data Exploration and Discovery: Looker allows users to explore and discover data in real-time using an intuitive interface that requires no SQL knowledge.
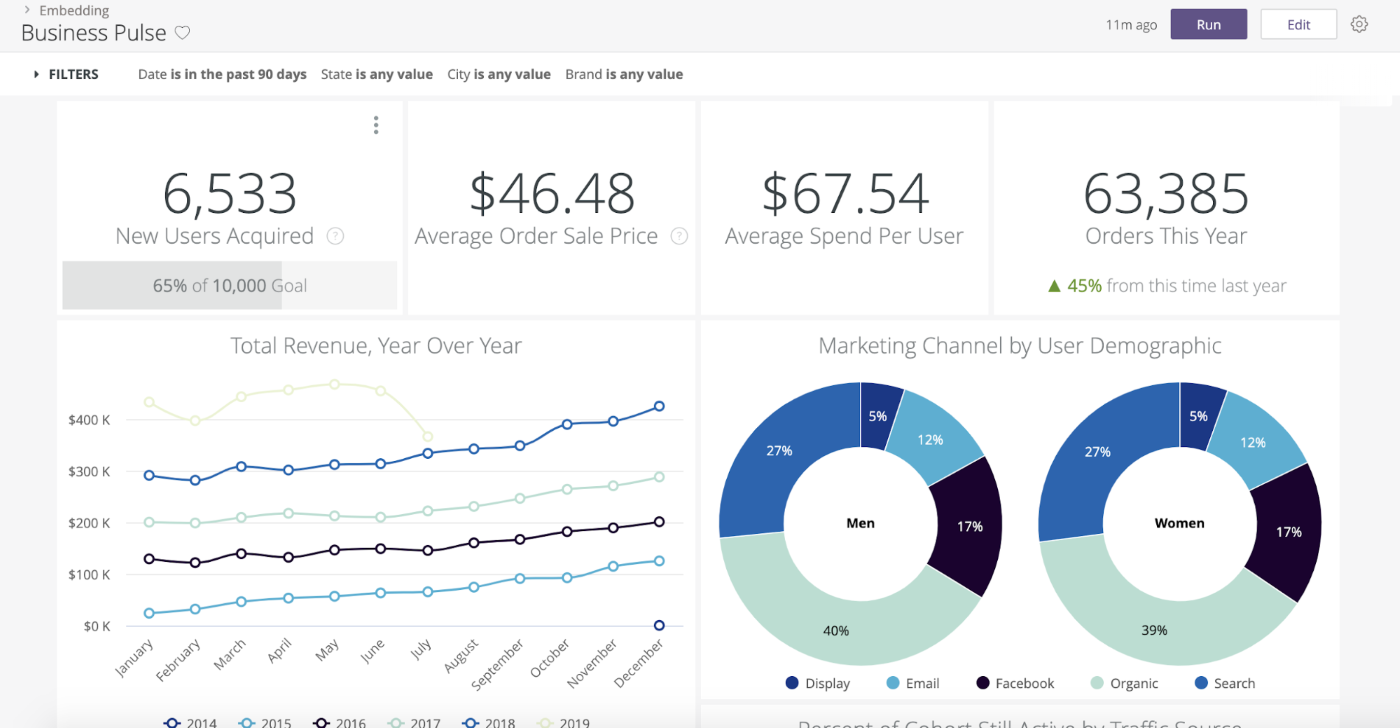
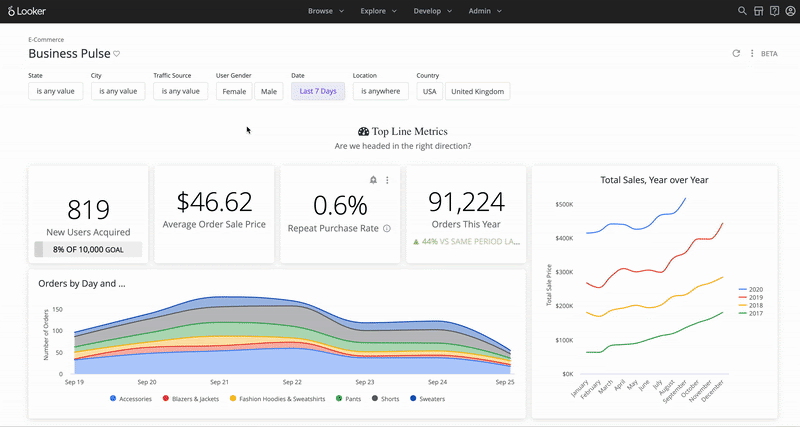
• Customizable Dashboards: Users can create and share interactive, customizable dashboards that offer a comprehensive view of business metrics.
• Integrated Workflow: Looker integrates seamlessly with other tools, enabling users to embed insights directly into business workflows and applications.
• Data Modeling Layer: The LookML modeling layer enables users to define business logic centrally, ensuring consistency across all analytics.
• Collaborative Data Analytics: Looker supports collaboration by allowing users to share data insights with team members through links, dashboards, or scheduled reports.
• Real-Time Data Insights: Looker provides real-time insights, enabling businesses to act on the most current data available.
• Embedded Analytics: Organizations can embed Looker’s analytics capabilities into their own applications to offer data-driven experiences.
• Robust Security and Compliance: Looker offers enterprise-grade security features and compliance certifications, ensuring that data remains safe and secure.

Overall Score
4.34/5
Pricing
3.13/5
General Features & Interface
3.75/5
Core Features
5/5
Advanced Features
4/5
Integration & Compatibility
5/5
UX
3.75/5
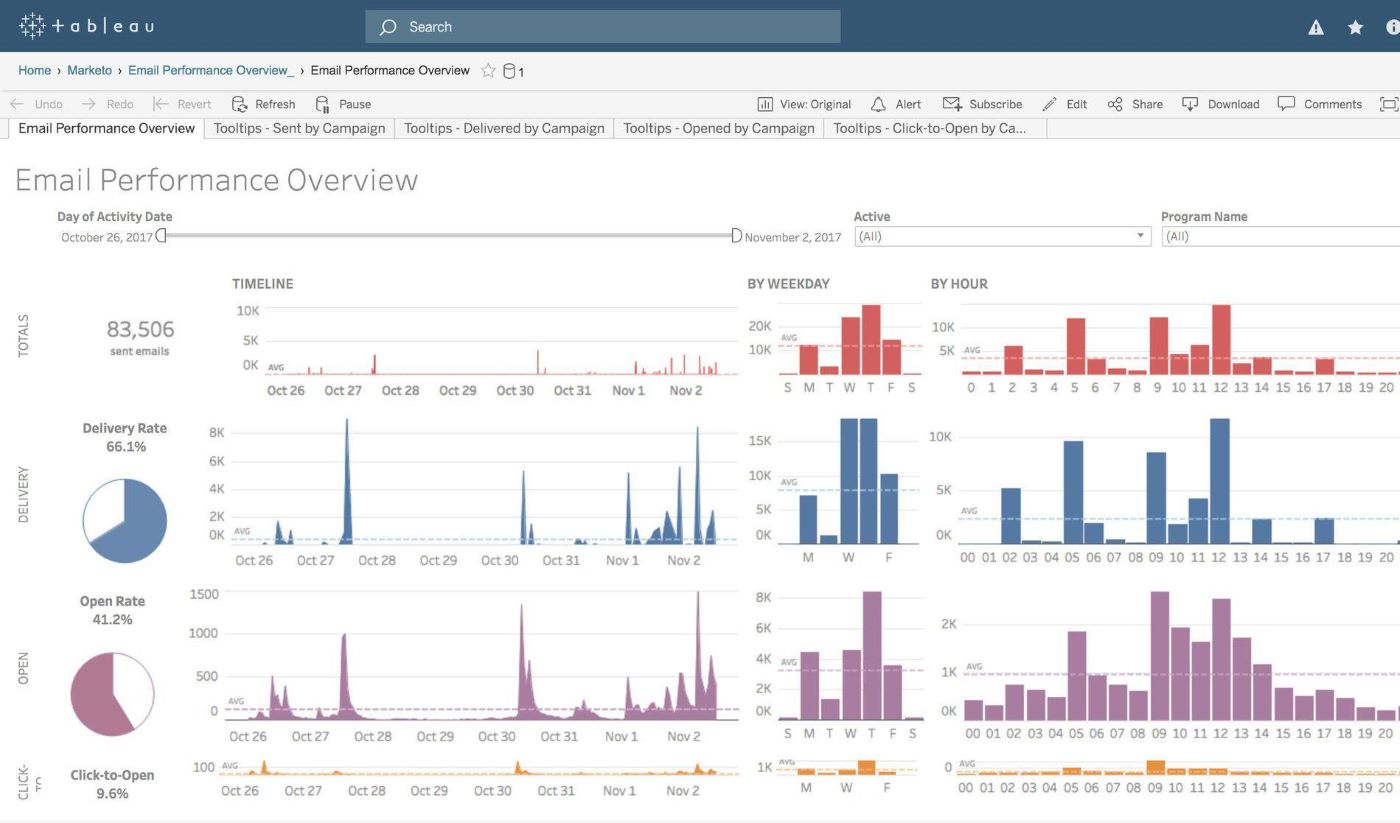
Tableau is a data visualization and business intelligence (BI) tool designed to help users interpret and understand their data.
Through its interface, users can create visual representations like dashboards, reports, and charts from raw data. The software allows for data integration from various sources, from databases to cloud services. Over time, Tableau has been adopted by many due to its straightforward features and ability to handle complex data sets. With each release, including the 2023.1 update, Tableau introduces modifications and improvements, reflecting feedback and the changing landscape of data analysis.
Business intelligence software has many tools to provide insightful details managers can use. However, to get the most out of one of these tools, managers need to know the company size, the types of charts and graphs needed, and the business analytical requirements.
With that data in hand, one can use this comparison as a tool to help make your final decision the right decision.
Looker and Tableau are both comprehensive, flexible, and scalable solutions that prioritize user accessibility and collaboration. While they each have their unique strengths and weaknesses, these core commonalities make them leading choices in the realm of business intelligence software:
Looker and Tableau both offer an array of BI tools to help businesses make informed decisions using advanced Machine Learning (ML) concepts.
You don’t need to be a data scientist to navigate through them; they’re built for everyone from the intern in the marketing department to the CFO. This universal appeal is what makes them so indispensable.
Integration is another area where both stand out. Whether your data lives in the cloud, in SQL databases, or even in good old Excel sheets, Looker and Tableau make it a easy to pull that data in.
Looker and Tableau have engineered their platforms to be highly scalable so they grow alongside your business.
Tableau offers a distributed server architecture that allows you to add more server nodes as your data and user base expand. This means you can handle larger data sets and more concurrent users without sacrificing performance.
Looker leverages an in-database architecture, allowing it to push queries to the database itself. This ensures that as your data grows, you can scale your database resources to maintain high-speed analytics. Both platforms also offer cloud-based solutions, providing the elasticity to quickly scale up or down based on your needs.
They offer nifty collaboration features that make it easy to share insights, annotate findings, and even distribute reports. It’s like a virtual huddle for your team, where everyone gets to contribute to the game plan.
Also read: Tableau Alternatives
Looker is fully deployed as a browser-based intelligence software with no desktop installation requirement. In addition, Looker offers a mobile app solution. Tableau is a desktop-based platform with a Tableau license for cloud access but with limited cloud capabilities. Looker uses its version of structured query language called LookML with pre-built Looker Blocks. Tableau uses a spatial file connector to create maps.
While those are substantial differences, when it comes to team-facing features, the two titles serve the same overall purpose.
Looker offers several key features that will enhance the ability to view data in real-time, build applications with embedded analytics, and provide proactive insights with instant alerting for quicker decision-making. Here are some of the key features of Looker:
SQL-based type language used for data modeling and complex data analysis.
Used to create unique applications or modify existing applications with embedded analytics.
Allows users to develop reports in ad-hoc or governed data environments, which allows for data analysis in ad-hoc and governed data environments.
Looker API is used for calling data while providing a secure RESTful API that allows users to create custom applications, workflows, and scripts that can automate tasks.
Looker is owned by Google and is built on their cloud infrastructure that is available as a service to allow users to manage their Looker instances.
Predefined and pre-built code that expedites the development of applications, workflows, and analytics.
A development platform that helps developers build Looker applications while automatically performing some of the necessary steps to save time.
Looker has a mobile solution for any Internet-connected mobile device that users can access using a QR code or biometric authentication.
Provides expected authentication and access controls that help businesses stay within compliance regulations.
Interface code that helps developers create filter controls like radio buttons, sliders, and tag lists, which can be embedded in applications or dashboards.

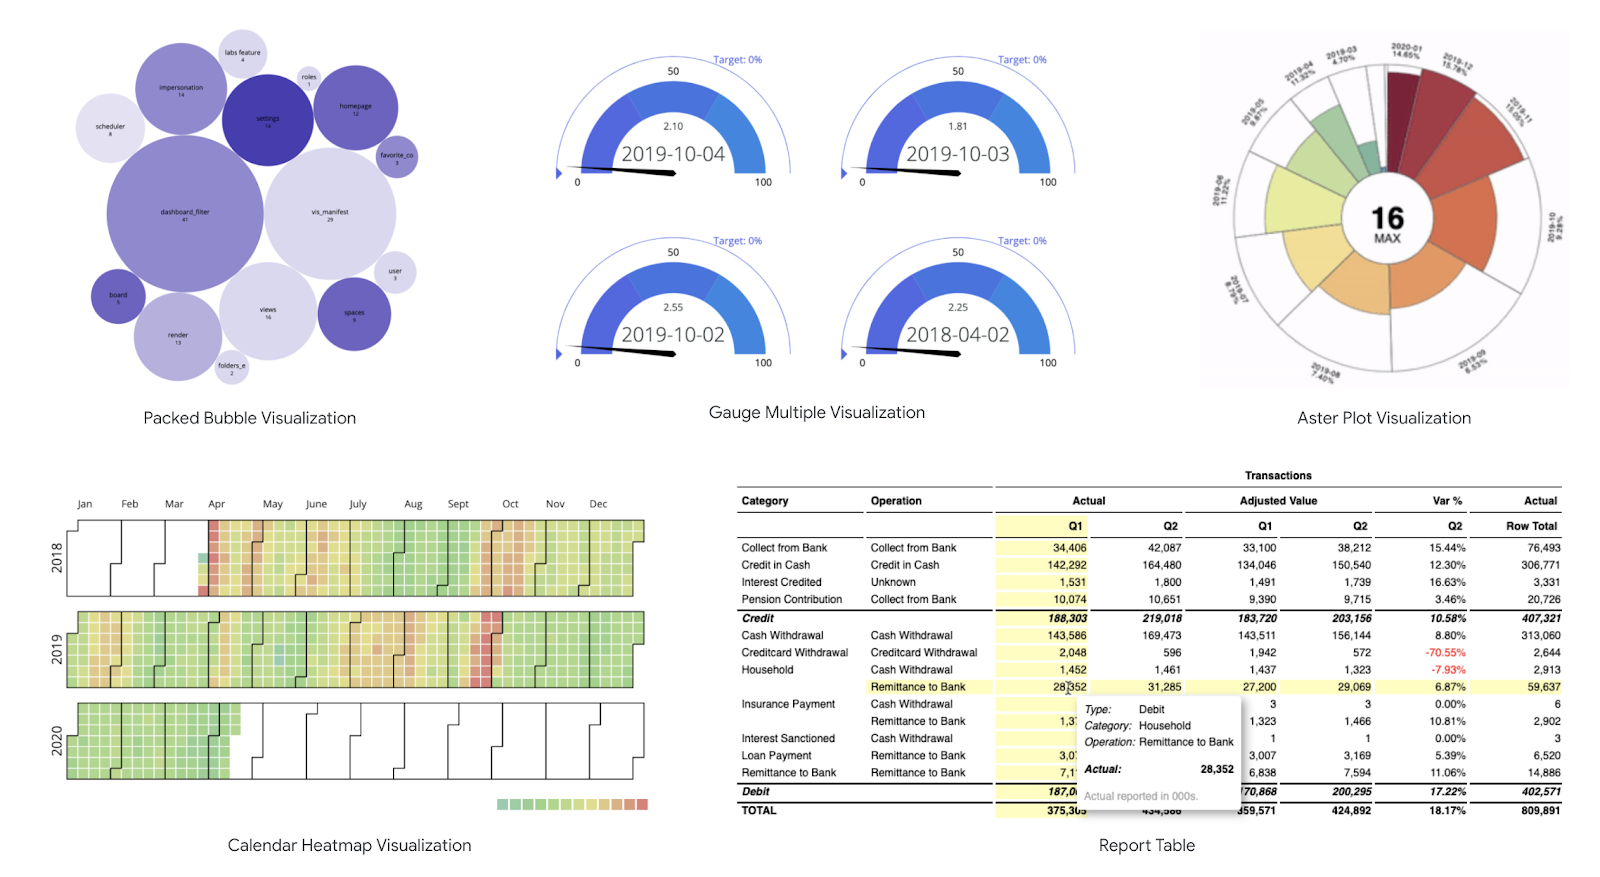
Tableau’s focus is on creating sophisticated visual representations of data. As a result, Tableau allows users to quickly analyze large amounts of data that can be converted into reports. Tableau has a heavy focus on dashboards, but here are some other key features of this BI solution:
Offers a wide variety of visual objects and text elements that can form stories or provide multiple views, layouts, and formats using the available filters.
Provides instant data sharing for quick reviews of dashboards and data visualization.
The ability to connect to live data sources or extract data from external sources allowing a user to access data from multiple sources without limitations.
A primary feature that allows users to create a wide variety of data visualizations.
Pre-installed map information on cities, and the maps can contain geology layers.
Tableau has a foolproof security system that uses authentication and a permission methodology for user access and data connections.
The ability to create views to be seen on iOS and Android devices.
Allows users to type a query about data using their natural language and the ability of this feature to respond with text or a visual representation as an answer.
Uses time series forecasting by selecting historical time-stamped data
As you can see, Looker and Tableau have different key features available to users. This section will look at some of the expected features of a business intelligence and data analytics software solution.
| Feature | Looker | Tableau | Advantage |
|---|---|---|---|
| Data Visualization | Looker provides a dynamic dashboard filter feature that can filter for data visualization types and specific users or groups. Looker also has a mapping feature to aid in chart creation. | Tableau specializes in visualization dashboards and infographics. Tableau provides pre-made templates and has a wizard feature that helps non-technical users. |  |
| Integration | Looker integrates with big data platforms and databases and can execute queries without extracting data | Tableau has over 200 connectors that can connect to multiple sources such as RDBMS, spreadsheets, Presto, SQL Server, Cloudera, Hadoop, Amazon Athena, and Salesforce | |
| Data Modeling | LookML is a data modeling tool that is reusable and flexible. LookML has pre-built modeling called Looker Blocks used to build sophisticated query analytics | Tableau uses snowflakes and dimensional data models that help improve the performance of queries | |
| Reporting | Provides basic reporting templates | Users can build customized reports with extensive connectors to create dashboards and reports | |
| Speed | Looker is slower, and users may need several hours to share a report | Allows a user to create visualization reports in short periods | |
| Advanced Analytics | Looker pre-built code blocks are configurable, and LookLM allows for a deeper analytical review of data | Tableau does not have pre-built code blocks, but it is more configurable than Looker | |
| Security | Looker provides an admin panel to change security settings and 2-factor authentication | Tableau allows a user to protect reports and dashboards, but not with the detail of Looker | |
| Mobile Support | Looker’s mobile app allows you to view data using any browser with an Internet connection. Emails and chat sessions are available too. Users can log in using a QR code or biometrics | Android and iOS devices can use Tableau’s mobile web application | |
| Pricing | For a company, $5,000/per month, but Looker offers a variety of business plans depending on size | Tableau’s creator license cost per user is $70/per month, and for a viewer, it’s $15/per month | |
The best BI solution is subjective since every company’s situation differs slightly. For example, a company that uses Salesforce may lean towards Tableau since Salesforce purchased Tableau four years ago. Any company heavily invested in using Google products may lean towards Looker. Just because a company uses Google or Salesforce products should not be the basis for a decision.
Other factors to consider are the existing infrastructure, analytical data needs, and storage preferences, whether cloud or local, are only a subset of reasons why a company may choose one BI product over the other.
A business need for a BI software solution was identified as a requirement. Next, the company generates a list of requirements on why BI software is needed. These requirements vary from company to company, but they are the driving force behind choosing a BI solution. Finally, decision-makers are on track to make the right decision using the key features and the comparison overview along with additional research.
Looking for the latest in Business Intelligence solutions? Check out our Business Intelligence Software Buyer’s Guide.
When comparing Looker vs Tableau, know both are powerful BI tools, but they serve different needs. Looker excels in data modeling and integration with SQL-based databases, while Tableau is known for its advanced visualizations and ease of use. The choice depends on your specific requirements.
The downside of Looker is its reliance on SQL for data exploration, which can be a barrier for non-technical users. Additionally, its pricing can be prohibitive for smaller businesses, and it may require more setup and customization compared to other BI tools.
Looker is expensive due to its robust data modeling capabilities, enterprise-level features, and deep integration with SQL databases. The cost reflects the advanced functionality, scalability, and customization options it offers to large organizations.
Yes, Looker is owned by Google. It was acquired by Google in 2020 and is now part of the Google Cloud ecosystem, enhancing its integration with other Google Cloud services.
Tableau is better for users seeking intuitive, visually rich analytics with minimal setup, while Looker is preferred for those needing strong data modeling and SQL-based querying. The best choice depends on your business needs and technical expertise.
Tableau uses a distributed server architecture to manage increased data and user loads, whereas Looker relies on in-database processing to scale alongside your database resources.
The post Looker vs. Tableau: An In-Depth Data Analysis Showdown 2024 appeared first on TechnologyAdvice.

Key takeaways
Continuous performance management is a style of performance management where team leads check in frequently with their direct reports. It’s a cycle made up of three steps: setting objectives, checking in with managers, and getting feedback.
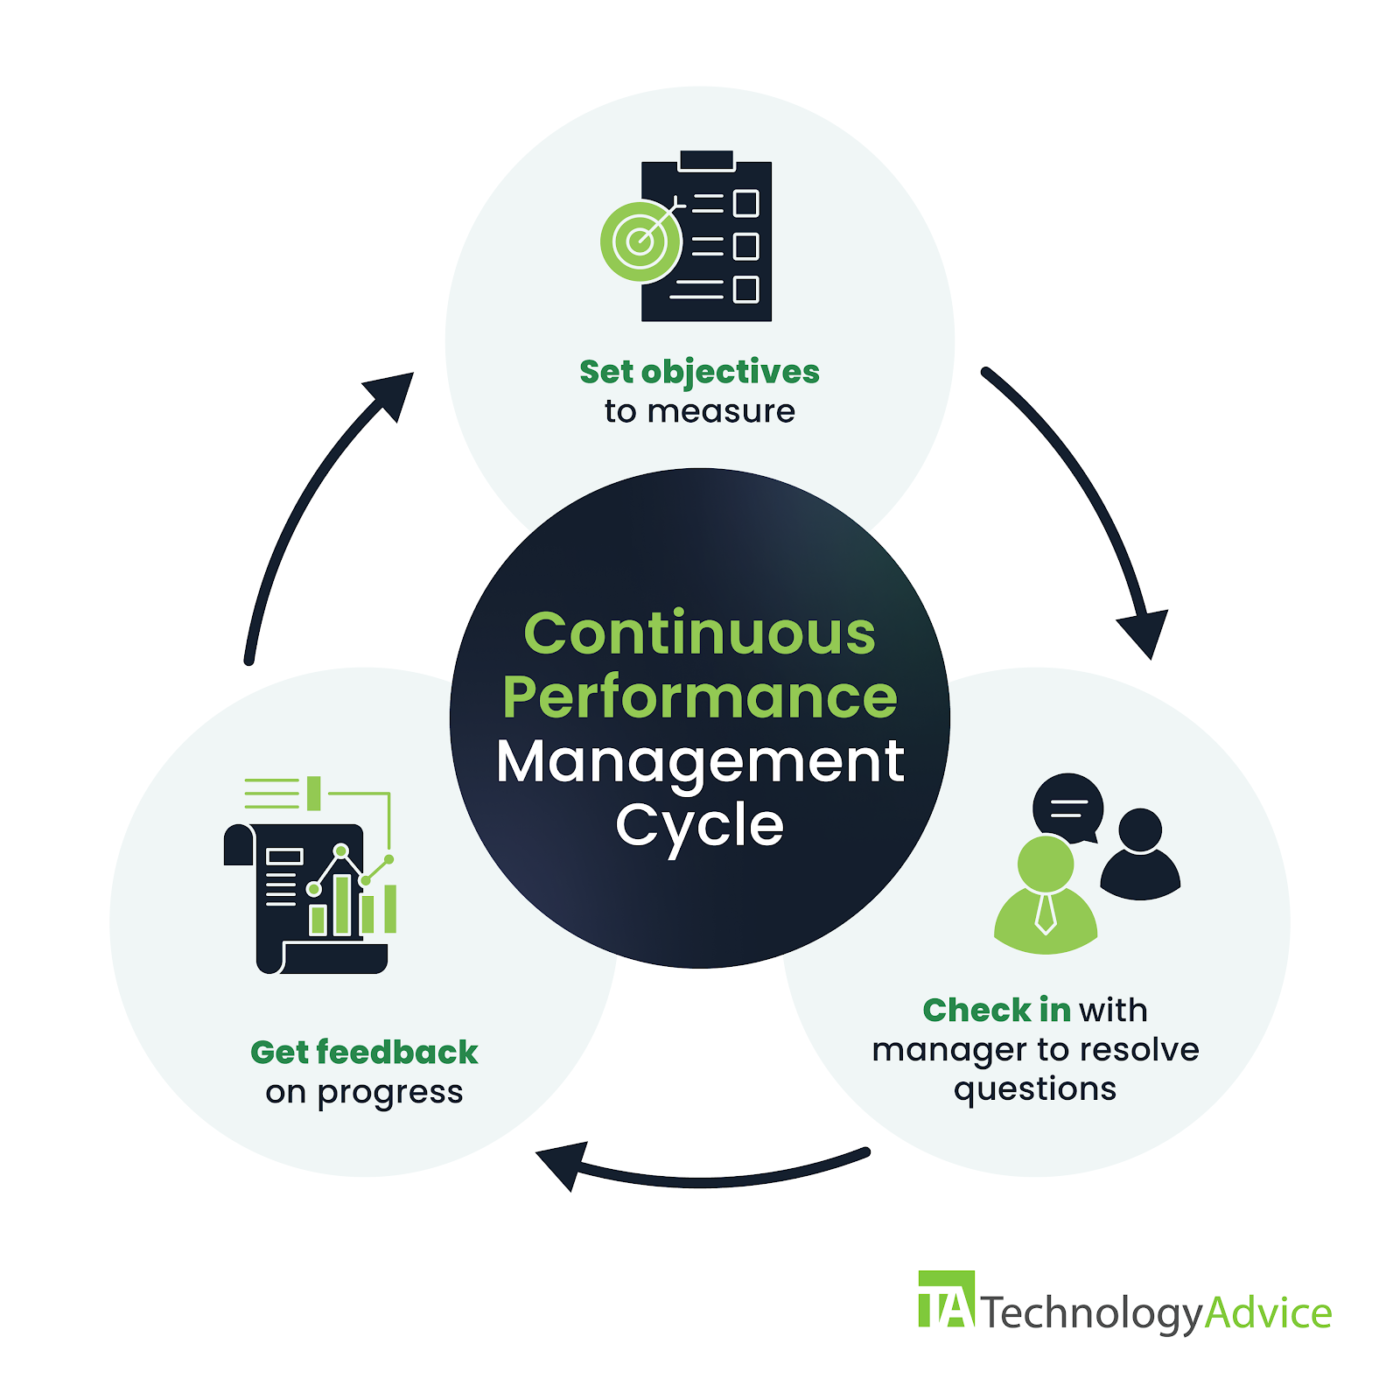
In a continuous performance management cycle, the employee and manager work together to create goals and metrics to measure them. Then they have at least one check-in meeting where a manager can answer questions and address any issues that have arisen. Finally, they have a review meeting where a manager offers more formal feedback. This gives the two of them an opportunity to adjust or set new goals, and the cycle begins again.
What sets continuous performance management apart from the standard performance review is its frequency. Most traditional performance reviews are conducted annually, while continuous performance management includes opportunities for feedback every few weeks. Frequent feedback ensures clarity on expectations so employees feel more confident in their contributions, and it gives them an opportunity to improve by acting on that feedback.
“89% of HR managers think that continuous performance management is more useful than traditional performance management.” — BetterWorks
Continuous performance management is also different from putting an employee on a performance improvement plan (PIP), since the former is a cadence of feedback for all employees, while the latter is meant to help struggling employees meet their goals. However, the structure of a PIP and a continuous performance management strategy can be very similar, since both of them rely on consistent feedback and 1:1s between manager and direct report. In fact, continuous performance management can serve as a good alternative to using PIPs.
Continuous performance management offers a variety of benefits. It can improve employee performance and engagement, and it helps foster transparency in larger performance reviews.
It’s hard to know how to improve without consistent feedback from your manager. If you only get structured feedback once a year, you could have spent the last year learning bad habits and turning in work that didn’t meet expectations without knowing it. On top of that, there’s just not enough time in one meeting to discuss everything that needs to be done.
Continuous performance management gives more opportunities for that feedback. Not only does that direct an employee’s growth, it also provides role clarification. That, alongside consistent, guided goal-setting, ensures that employees are working on the right things that affect the company’s bottom line.
Frequent, meaningful feedback makes you feel like what you do matters. If you’re just submitting work and moving on, it can feel like you’re not contributing to the broader organization. That has an impact, especially on the younger generation of workers; most of Gen Z want to do meaningful work that keeps them engaged.
“80% of employees who say they have received meaningful feedback in the past week are fully engaged.” — Gallup
In addition to constructive feedback, continuous performance management meetings are a great place to provide recognition for an employee’s good work. Recognition is another element that dramatically affects employee engagement; in a survey by Great Place to Work, 37% of respondents said they’d be motivated to do better work if they received personal recognition.
Continuous performance management provides a much more comprehensive record of employee growth and success than traditional performance reviews. Frequent goal-setting and reviewing means managers see the details of everything an employee has attempted and accomplished.
That’s incredibly important when it comes to those end-of-year overall reviews, which are often tied to promotion and compensation cycles. The more accurate record gives employees an opportunity to advocate for themselves and see that their hard work is rewarded with career growth. An employee using continuous performance management can go into an annual review confident that they are meeting the expectations set by their role and contributing to their company’s objectives.
Further reading: Why is Performance Management so Important?
It’s one thing for a manager to set up a continuous performance management system with their direct reports. If you want to implement this system company-wide, though, HR needs to play a role.
Thankfully, the strategy for setting up continuous performance management isn’t too different from setting up any sort of performance management strategy, at least with regard to the decisions that need to be made.
You’ll need to decide on meeting cadences, create a universal goal-setting system, and make sure your managers are trained on how to provide effective feedback. Then, you’ll need to implement the change carefully, communicating openly, and giving people plenty of time to adjust.
Meeting frequency is a difficult needle to thread. Too few check-in opportunities, and employees don’t get enough feedback. Too many, though, leaves people drowning in pointless meetings. There’s also the very real concern of Zoom fatigue.
There is plenty of research you can use as your baseline when it comes to determining meeting cadence. For example, according to research by TruQu, 76% of employees want feedback on their work at least once a month.
It might also be wise to allow for some wiggle room for individual managers; if they find that more or fewer meetings work for their team, they shouldn’t be punished for making that adjustment.
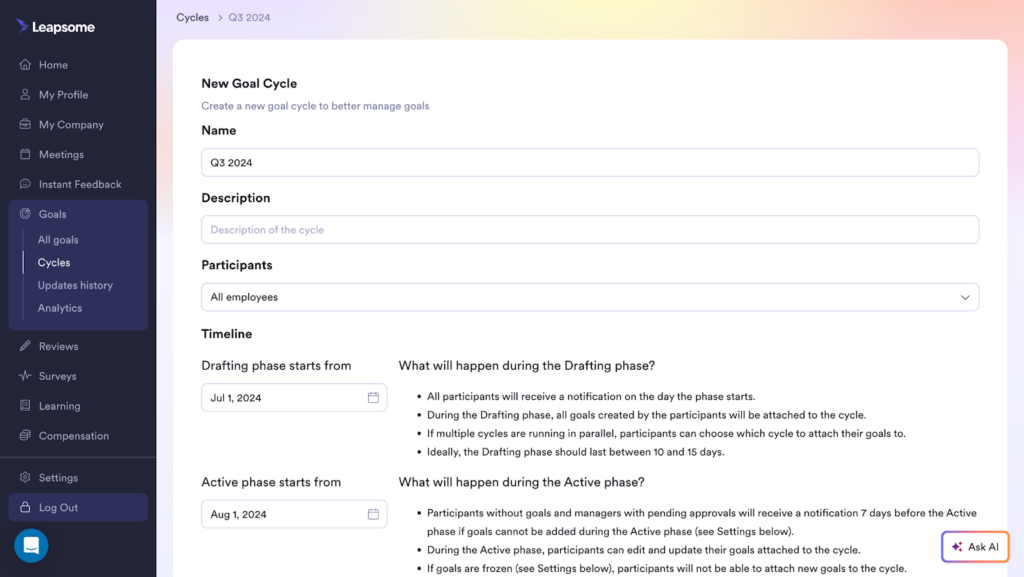
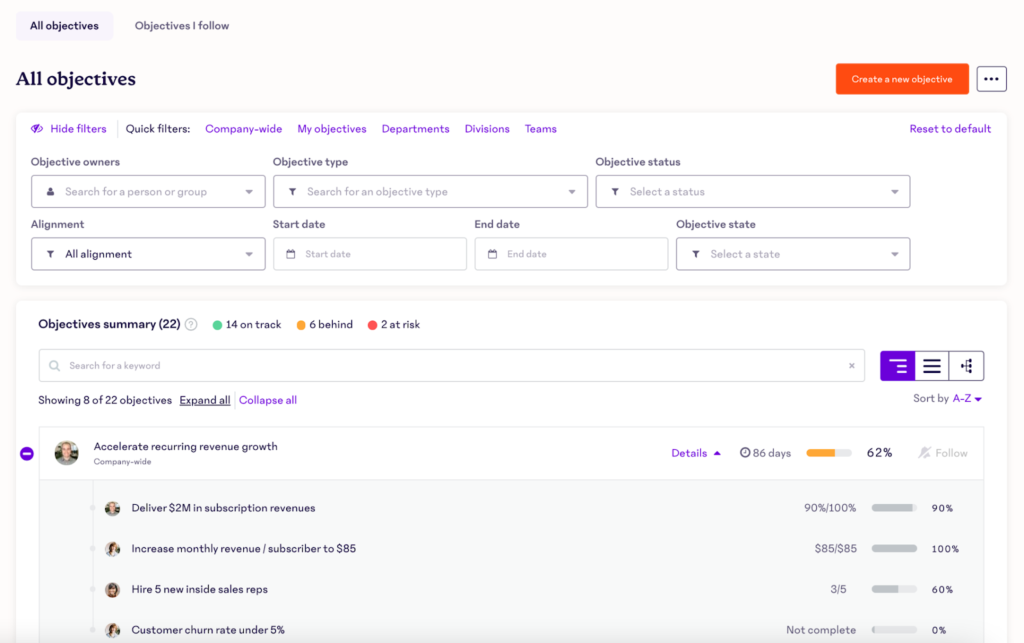
It’s important to make sure that your organization is aligned on how to create, set, and measure goals. Implementing a system like SMART goals, OKRs, or KPIs can help ensure consistency across the board.
It’s important to emphasize the scope of goals in a continuous performance management system. Whatever goals managers and direct reports are setting need to be reasonable within the timeframe of a review cycle. Using a goal-setting software like Leapsome or 15Five can be very helpful for keeping goals organized and measurable.
Feedback is a learned skill. Anyone can offer their opinion, but it takes practice and training to give feedback that is effective and constructive. Unfortunately, it is a skill that many managers seem to be lacking. According to a report from OfficeVibe, 64% of employees think the feedback they get from their managers could be improved.
Continuous performance management strategies rely heavily on the quality of a manager’s feedback for each employee’s success. As such, it’s important to make sure that those managers are well-trained before making the transition to any such system.
For tips on creating a training program that works, check out How to Create a Training Program for Effective Employees.
When making any major change to a company’s operational structure, it’s important to roll out the change slowly and with transparency. Simply dropping the plan on your managers’ laps and expecting them to implement it will only cause confusion. Communication and pacing are both key to rolling out continuous performance management.
When communicating this change, be clear about the steps and timeline of implementation. Explain the benefits of continuous performance management, and provide space to answer anyone’s questions or concerns.
Your communication strategy can’t end once the system is in place, either. Take time to gather feedback from managers and employees during the whole process, and make changes if necessary.
Further reading: Rethinking the Performance Appraisal: 4 Ideas for Improving Consistency Across Your Company
The first and arguably most important use of performance management software is that it connects and organizes data. Software is a great resource to make sure employee goals are in line with organizational objectives and paint a fuller picture of an employee’s impact. Such systems of connecting data also help keep the consistency and alignment across the whole business.
Software also takes some of the administrative labor off of HR, giving them time to work on performance management strategy. Moreover, many apps can schedule review and 1:1 cadences, send reminders, and provide templates of review documents. These tools also keep track of employee compensation and job title changes over time.
Finally, many performance management apps have AI tools that assist in your strategy. Some AI tools provide insights and suggested action plans based on performance data. Others prevent bias by checking feedback language used by managers and monitoring equity and fairness in growth and compensation to meet DEI goals.
Every performance management software is different, and some might suit your needs better than others. Check out our handy Performance Management Software Guide to help determine which software is best for your business.
The post What is Continuous Performance Management? appeared first on TechnologyAdvice.